Universal Debugger & Trace
Most cores for the embedded market provide access to on-chip debug features via a debug port. TRACE32 tools connect to this to control the core, access the data being processed by the core and provide developers with debugging over the embedded device: start, stop, step control; reading and writing memory and registers; setting breakpoints; tracking values of variables and so on. This means developers can diagnose software failures and memory corruption issues and correct the system to make it perform as expected. Lauterbach TRACE32® tools support almost all common microprocessor architectures in use in the embedded market. The tools are designed around common modules which are universal and architecture independent.
A debug system normally consists of a standard interface module and an architecture-specific debug cable providing standard debug features such as:
- JTAG, cJTAG, SWD and other debug interfaces
- Run control (program-/data-breakpoints, single stepping, real-time trigger)
- FLASH programming
- Multicore debugging
- OS-support with task analysis, UEFI
- HLL debugging (C, C++)
As debug information is provided by the on-chip debug interface, it becomes possible to test and analyze every aspect of the target operation including the bootstrap code, the target initialization, the interrupts, the drivers and the kernel. For OS types which dynamically load processes, a special detection mechanism is provided that catches the processor exactly on the entry point. This allows the developer to debug each process right from the start.
The debugger is available for all the common processors or SoCs on the embedded market. Since Lauterbach provide support for many kinds of cores, e.g. standard controller, DSPs, FPGA softcores and configurable cores, everything can be combined into a multicore chip and debugged with a TRACE32 debug tool.
PowerDebug E40
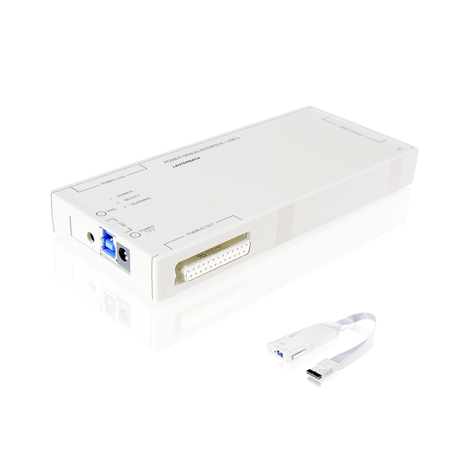
• USB3.0(/USB2.0) interface to all hosts
• Connects to target via TRACE32 Debug Cable or TRACE32 CombiProbe, which provide debug support for many core architectures, such as ARC, Arm Cortex , Power Architecture, RISC-V, TriCore, Xtensa
• Trigger connector to send and receive trigger pulses
PowerDebug X50
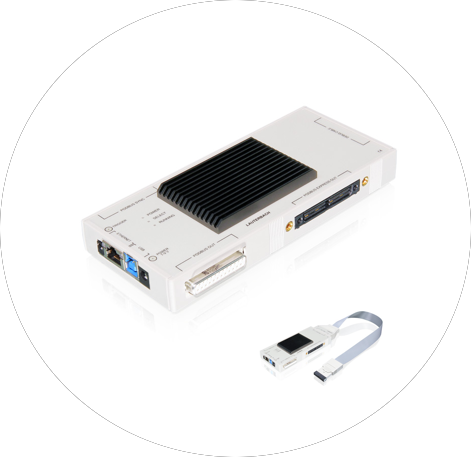
• USB3.0(/USB2.0) and Gigabit Ethernet interface to all hosts
• Connects to target via TRACE32 Debug Cable or TRACE32 CombiProbe, which provide debug support for almost 100 core architectures, such as ARC, Cortex-A/-R/-M, Power Architecture, RISC-V, TriCore, Xtensa
• PODBUS Express interface to TRACE32 trace extension modules PowerTrace II LITE / III and PowerTrace Serial, which provide off-chip trace support for all common standardized and proprietary trace protocols
• Trigger connector to send and receive trigger pulses