Protocol Analyzer
A debug system can be extended by adding a trace module or a logic analyzer. In some cases, both can be added to provide a very capable hard and software debug solution. Such a system can provide signal trace for logic analysis and protocol analysis as well as correlating power usage to the code operation.
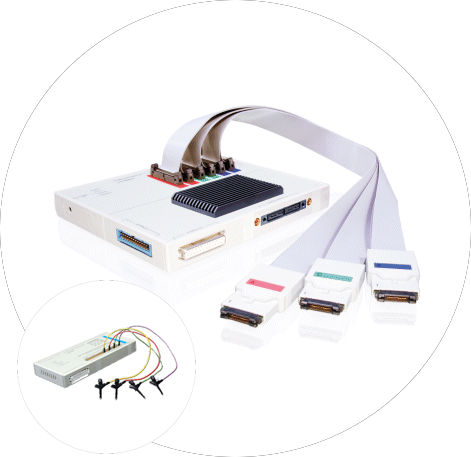
Typically the PowerProbe or PowerIntegrator is used to trace a target-specific interface which follows a certain protocol. This can be a serial channel, USB, CAN bus, memory busses for SDRAM or FLASH or any other protocol you can think of.
In many cases it is tedious to analyze the traced raw data manually. It is far more convenient to let the computer transform the traced raw data into a higher level of abstraction, for example into the display of transferred bytes, or even into a summary of sent/received packets.
The TRACE32 software offers an extremely flexible feature to support such a protocol analysis: There is an open programming interface which allows to transfer the raw trace data to an user made analysis software (DLL) which returns the results to the TRACE32 software. The TRACE32 software can display the results in a separate window and it is easy to switch between different levels of abstraction.
Furthermore for memory busses the returned (calculated) buscycles (address bus, data bus, cycle type) can be combined with the application source code to show the program flow on ASM or HLL basis.
The analysis of protocols like I2C, JTAG, CAN or USB is already part of the TRACE32 software.