Universal Debugger & Real-Time Trace
In many applications it is no longer enough to run a simple test on your code. In markets such as automotive, medical, aerospace and defence, it is increasingly necessary to prove how the code behaved under all possible conditions in real-time. This requires the tools to record the program flow information from the core via the integrated trace port of the processor. Both long-term and high-speed trace options are supported. Lauterbach TRACE32® tools support almost all common microprocessor architectures in use in the embedded market. The tools are designed around common modules which are universal and architecture independent.
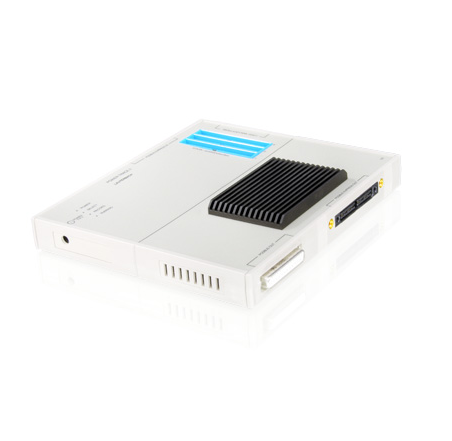
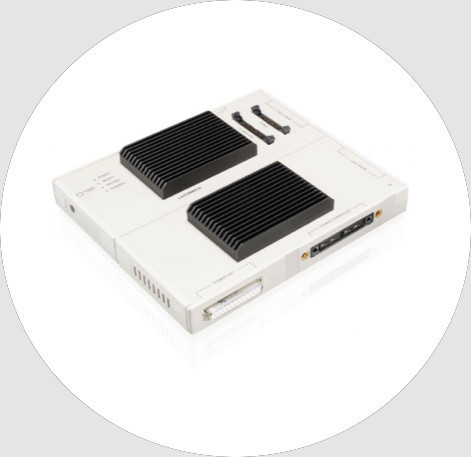
PowerTrace modules are extensions to the debug module TRACE32 PowerDebug X50. They provide the memory for recording core, bus or system trace information via parallel or serial trace ports. Their super-fast memory controller guarantees: Continuous recording of trace data even at very high bandwidth.
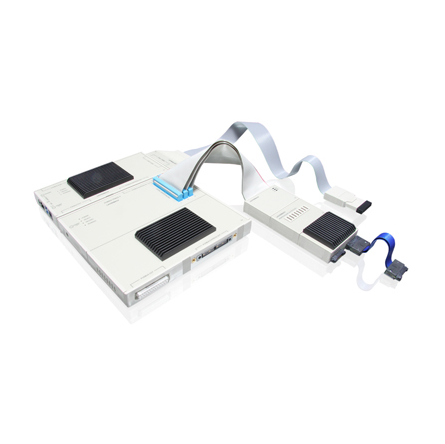
A debug and trace system is composed of standard debug/trace modules and architecture-specific debug cables/trace probes (called preprocessors), which connect the base modules to the targets. In addition to the debug features:
- JTAG, cJTAG, SWD and other debug interfaces
- Run control (program-/data-breakpoints, single stepping, real-time trigger)
- FLASH programming
- Multicore debugging
- OS-support with task analysis, UEFI
- HLL debugging (C, C++)
it provides:
- Serial and parallel off-chip trace (ETM, Nexus, etc.)
- Non-intrusive flow trace
- Time-correlated multicore trace
- Run-time analysis and statistics
- Long-time trace (streaming)
- Code coverage
If needed, streaming of trace data to the host computer is supported. Trace information is timestamped (5 ns resolution) when stored. The decoding of core trace data requires a suitable license. All PowerTrace variants have PODBUS Express interface to PowerDebug PRO that allows a fast upload of the trace information to the host computer.
PowerTrace II LITE / III connect to the target via a TRACE32 Preprocessor.
• TRACE32 AutoFocus II Preprocessor
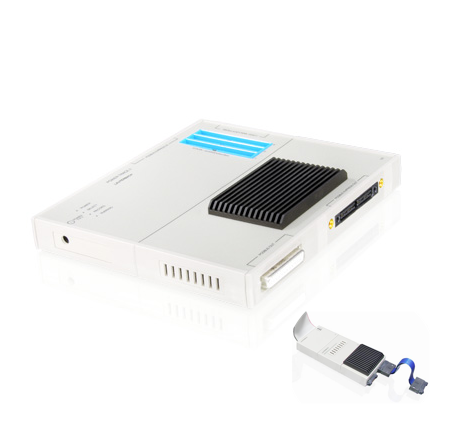
Records trace information at a parallel trace port (up to 32-bit). It is pre-licensed for a core trace protocol at delivery. Licenses for additional core traces can be added later.
• TRACE32 Serial Preprocessor
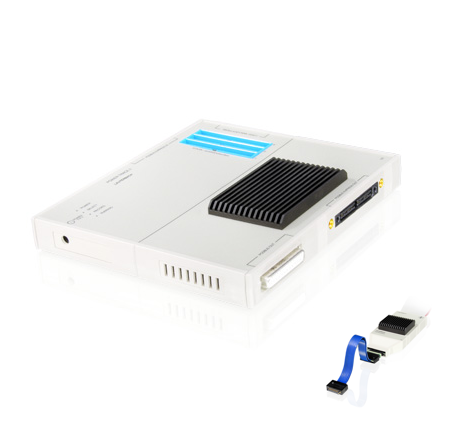
Records trace information at a serial trace port that uses an Aurora based protocol. Supported are up to 4 RX lanes, each lane up to 6.5 Gbit/s.
PowerTrace II LITE / PowerTrace III
The characteristics of the individual PowerTrace II / III modules at a glance:
PowerTrace II LITE
• 512 MByte trace memory
• Maximum bandwidth of 10.8 GBit/s
• Support for TRACE32 Streaming up to 50 MByte/s
• More …
PowerTrace III
• 8 GByte trace memory
• Maximum bandwidth of 19.2 GBit/s
• Support for TRACE32 Streaming up to 400 MByte/s
More …
PowerTrace Serial
The characteristics of PowerTrace Serial at a glance:
PowerTrace Serial trace modules cover all high-speed serial trace ports from low lane count, low bit rate up to the highest lane count and fastest bit rate available in the embedded industry. They support all chips with serial trace port and not only the Aurora/HSSTP protocol, but also tracing over PCIe.
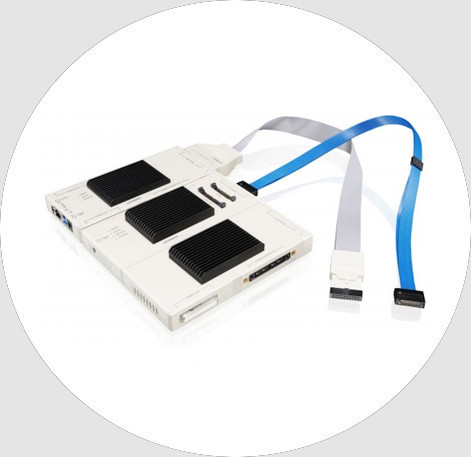
- Up to 8 GByte of trace memory
- Serial trace via Aurora or PCIe with up to 8 lanes
- 22.5 Gbit/s per lane on up to 4 lanes
- 400 MByte/s streaming
- More …