Debugging via USB and Intel® Direct Connect Interface (Intel® DCI) DbC

Highlights
• Stop-mode debugging for form factor devices
• Stop-mode debugging via USB protocol stack
• Standard JTAG is wrapped into DCI packets
• SMP debugging (including hyperthreading)
• AMP debugging with other architectures
• BIOS/UEFI debugging with tailor-made GUI for all UEFI phases
• Linux- and Windows-aware debugging
• Support for Intel® x86/x64, ARC, M8051EW, Xtensa
Configuration of the Software-only Debugger
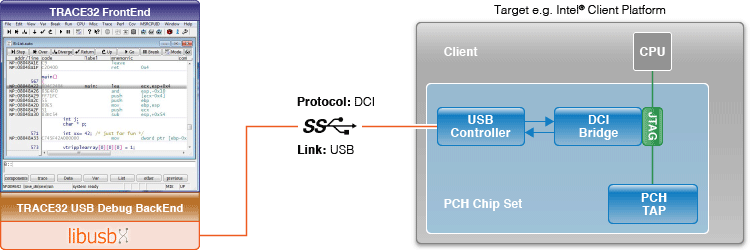
Debug commands entered via the TRACE32 FrontEnd are converted by the TRACE32 USB Debug BackEnd into JTAG commands and wrapped into the DCI protocol. The DCI packets are sent to the target with the help of libusb.
The DCI bridge on the target side unwraps the DCI packets and passes the JTAG commands to the appropriate TAP/CPU.

Intel and the Intel logo are trademarks of Intel Corporation or its subsidiaries in the U.S. and/or other countries.

