TRACE32® PowerView – GUI
The graphical user interface (GUI) of Lauterbach’s TRACE32® is called TRACE32 PowerView. The TRACE32 PowerView user interface is based on an extremely fast, character oriented window system.
TRACE32 PowerView provides an integrated debug environment and a universal interface for the entire tool family. Menus, toolbars and dialog boxes offer intuitive and fast access to all debug, trace and logic analyzer features. It guarantees a consistent control for all tools and a coherent display of all software and hardware information required for debugging, tracing and further analysis. As a flexible user interface, PowerView allows developers to configure the environment to meet their specific needs. For example:
- Free selection of host interface and host OS
- Free selection of programming language and compiler
- Free selection of the OS on the target
- Free selection of the CASE tools
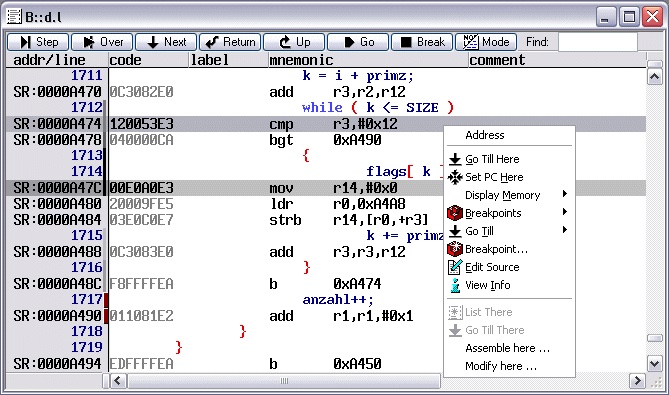
ASM Debugger
The TRACE32 ASM debugger is an integrated feature of all TRACE32 systems. The debugger has its own data base and interfaces to most common standard assemblers. The ASM debugger offers easy source level debugging with advanced features.
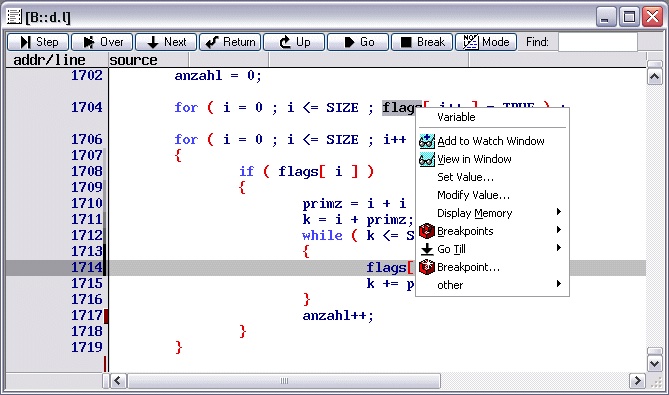
High-Level-Language Debugging
The TRACE32-HLL debuggers are integrated features of all TRACE32 emulation probes. The debugger has its own data base and interfaces to most common standard compilers systems. It uses all information supported by the compilers.
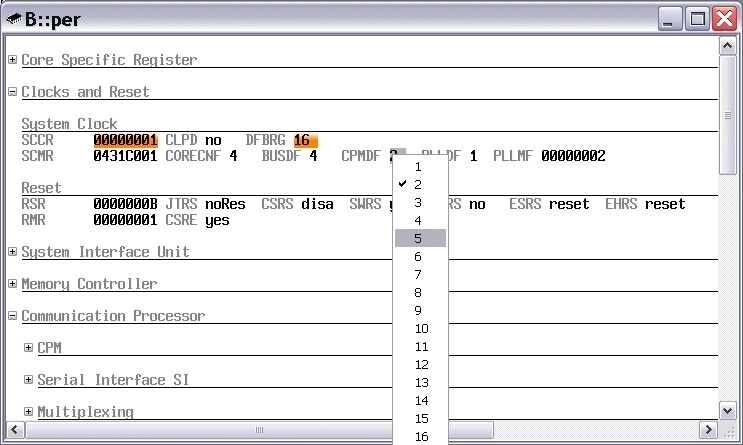
Logical Display of Peripherals
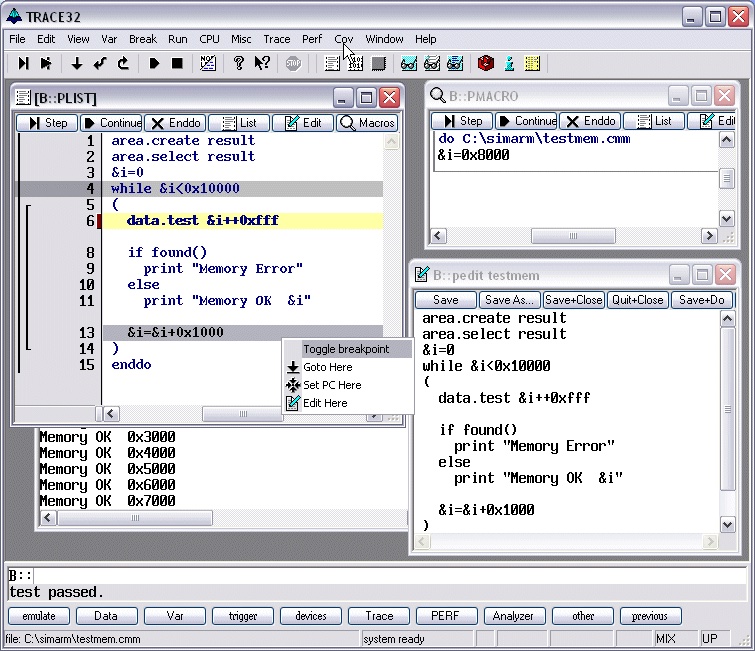
Script Language PRACTICE
TRACE32 has it′s own special BASIC-like meta-language called PRACTICE II which is a superset of it′s fundamental commands. Complete programs may be constructed using PRACTICE II for automatic testing or for the construction of command macros. All aspects of the systems may be controlled/programmed via the PRACTICE language.
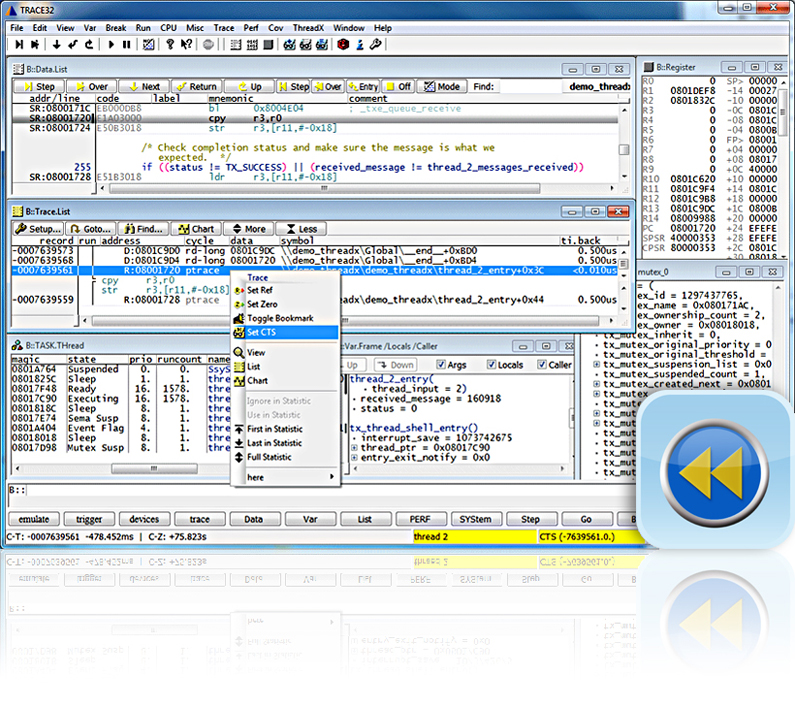
Trace-based Debugging (CTS)
In the past it was necessary to spend a lot of time analysing the trace listing in order to find out which instructions, data or system states had caused malfunctioning of the target system.
Now Trace-based Debugging – CTS for short – allows the user to recreate the state of the target system at a selected point based on the information sampled in the trace buffer. From this starting point the program steps previously recorded in real-time in the trace memory can be debugged again in TRACE32 PowerView GUI.
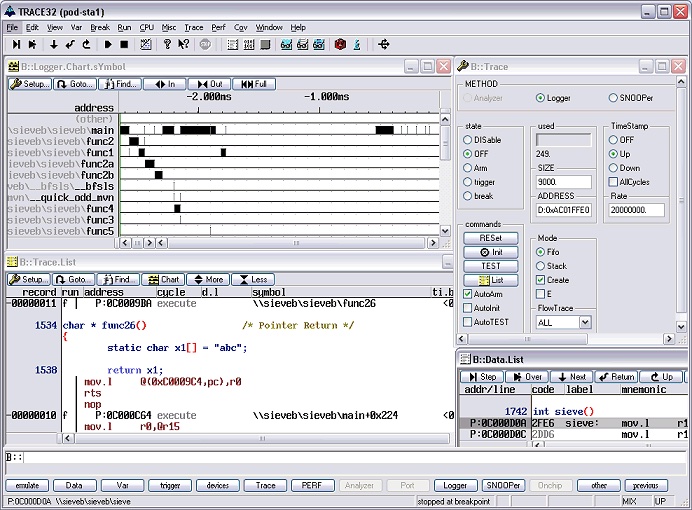
Logger
The LOGGER feature provides a target based software trace. Instead of using a real trace buffer the trace data are stored in an array structure in the target RAM. Entries into this array can be made by instrumenting the code. By the use of a general, predefined trace format all TRACE32 commands for trace display and analysis can be used. A typical usage of the LOGGER feature is the trace and analysis of RTOS task switches.
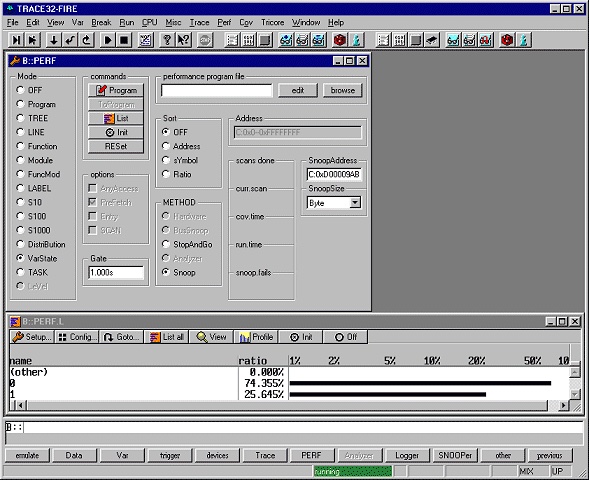
Snooper
The SNOOPER feature provides a low or non intrusive way to sample data while the target is running. The data can either be sampled by reading selected memory areas or by reading from a special communication port (ARM).
When the on-chip debug logic supports memory reads while the CPU is executing the program (68HC12, C166CBC, C166SV2, TRICORE, ColdFire, MPC56x-Nexus, TI320) the tracing can be done without stopping the target CPU or modifying the target program.
FLASH Programming (Memory-Mapped)
Lauterbach’s policy is to support all common memory-mapped flash memories.
Sample-based FLASH Programming (Protocol-Based)
Lauterbach’s policy is to support all common flash controllers and flash devices.
Multicore Debugging
Lauterbach has supported debugging and tracing of multi-core chips for more than 15 years.
A long-standing aim for Lauterbach has been to make its TRACE32 hardware and software as flexible as possible. Every core combination, every multicore topology, every multicore operation mode, and even the most complex debug and trace infrastructures are all supported by TRACE32.
OS-aware Debugging
The TRACE32 RTOS Debugger is an adaptive debugger, which allows debugging on target systems using real-time kernels. The debugger is fully integrated in the user interface. It allows the display of kernel resources, task selective debugging and many sophisticated real time analysis functions. The analysis functions include symbolic system call trace and detailed performance analysis functions.
The configuration to different RTOS’s is controlled by a dynamically loaded extension. By changing this extension, the user may adapt the debugger to nearly any RTOS. Standard configurations are available for the most used kernels. The extension can also be used to define user specific windows for any kind of special data structures. The supported features vary between different kernels. Not all features are supported for all processors and kernels.
3rd Party Tool Integration
Editor Integration, CASE Tool Integration, Kernel Integration.
TRACE32®
Lauterbach provides comprehensive integrated debug environments for embedded designs. The TRACE32® product portfolio covers the whole development process and includes a Universal GUI (PowerView), Debug tools, Trace tools for program/data flow and Logic analyzer tools. TRACE32® tools support over 80 of the most common microprocessor architectures in use in the embedded market.
Supported Host Systems
• MACINTOSH
MACOS X64 macOS>=10.12, Qt5 – Apple Inc.
• PC
WINDOWS XP 32 bit; EOS 09/2020 – Microsoft Corporation
WINDOWS VISTA 32/64 bit; EOS 09/2020 – Microsoft Corporation
WINDOWS 7 32/64 bit – Microsoft Corporation
WINDOWS 8 32/64 bit – Microsoft Corporation
WINDOWS 10 32/64 bit – Microsoft Corporation
LINUX 32bit, Motif; EOS 09/2020
LINUX 32bit, Qt4/5; EOS 09/2020
LINUX 64 bit, Qt4; EOS 09/2020
LINUX 64 bit, Qt5/Motif
• SPARC
SOLARIS 10 CDE – Oracle Corporation
SOLARIS 11 CDE – Oracle Corporation