CombiProbe 2 Intel® Direct Connect Interface (Intel® DCI) OOB
Highlights
• CombiProbe DCI OOB for closed chassis targets with USB3 port and DCI OOB capability
• CombiProbe DCI OOB provides debug and system trace capability
• Support for standard JTAG, debug HOOKs and system trace via DCI protocol
• 512 MByte of trace memory
• SMP debugging (including hyperthreading)
• AMP debugging with other architectures
• BIOS/UEFI debugging with tailor-made GUI for all UEFI phases
• Linux- and Windows-aware debugging
• Hypervisor debugging
• System trace configuration and decoding via the Intel® Trace Hub library
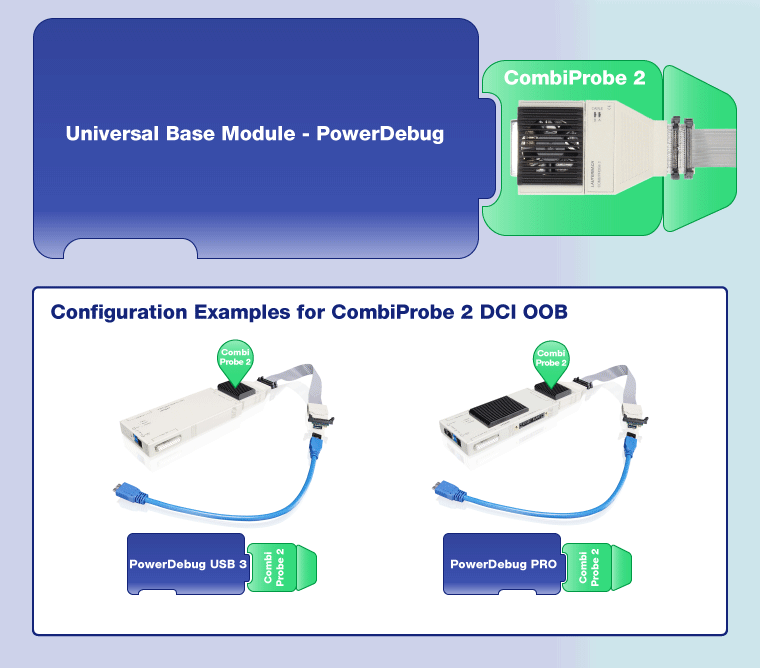
The photo on the right side shows the TRACE32 configuration for Gigabit Ethernet.
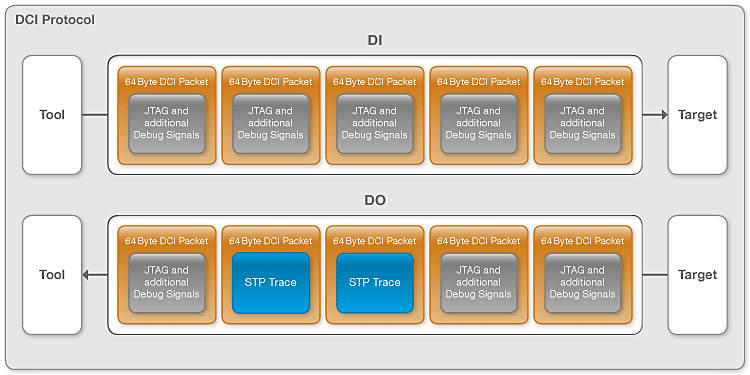
DCI OOB Protocol
Debug commands entered via the TRACE32 PowerView GUI are converted by TRACE32 into JTAG commands and wrapped into the DCI OOB protocol. TRACE32 sends these commands to the target system.
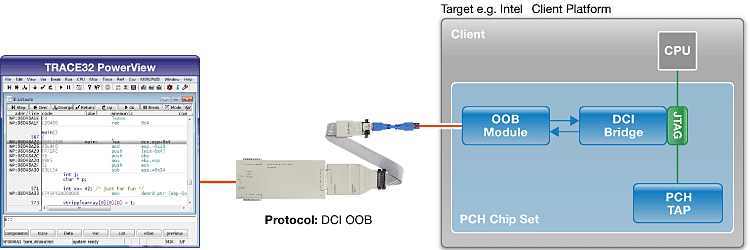
In the target system the commands are decoded by the OOB module and forwarded to the DCI bridge. The DCI bridge on the target side unwraps the DCI packets and passes the JTAG commands to the appropriate TAP/CPU. The communication between the target and the tool traverses the same path backwards.
Trace data can be exported through the DCI bridge/OOB module and are recorded by the CombiProbe.