Original article by Mr. Maurizio Menegotto, Managing Director of Lauterbach SRL – Italy
Lauterbach and Arduino: Professional Tools for Professional Users
What is Arduino Pro?
Arduino was born as an open source hardware and software platform for the development of interactive projects and has become a worldwide „de facto” standard for prototyping.
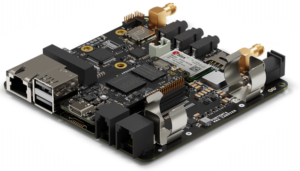
The new Arduino Pro division is aimed at the kind of professional user who needs the extra power and flexibility of advanced, safe and high-performance architectures. TRACE32, with its flexibility and advanced debugging capabilities, is the ideal solution for these developers.
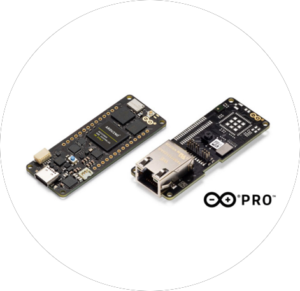
The Arduino Portenta family has been expanded by ad- ding the new, powerful Portenta H7. This is based on the STM32H747 device and features dual Arm Cortex-M cores: a Cortex-M7 clocked at 480MHz and a Cortex-M4 clocked at 240MHz. Both cores have access to all of the chip’s rich peripheral set and it forms an ideal platform for IoT and Industry 4.0 applications. The system comes with Arm‘s Mbed OS and can run both native Mbed applications and Arduino sketches. Systems based on this solution offer very high performance and can be very complex, requiring the use of professional debug tools. For over four decades, Lauterbach‘s TRACE32 debugger has been at the forefront of debugging technology by offering innovative and advanced functionality, and it is this wealth of experience and expertise that Arduino will draw on for the Pro family of devices.
The Arduino and Arduino Pro software development environment
Two Integrated Development Environments (IDEs) are made available to users: the classic Arduino IDE, or the new Arduino Pro IDE which is available for Windows, Linux and Mac OSX. Both environments allow the compilation of projects for Portenta H7 and their upload via the serial flash loader. The compilation takes place using the included GNU GCC (g ++) compiler and generates a file in ELF/Dwarf symbolic format suitable for symbolic debugging with TRACE32, even in the presence of optimized code.
The TRACE32 debugger is also available for Windows, Linux and Mac OS X. The demo system provided with TRACE32 for Portenta H7 includes scripts for automatic debugger configuration and to locate the correct ELF file to load for debugging and for programming into flash.
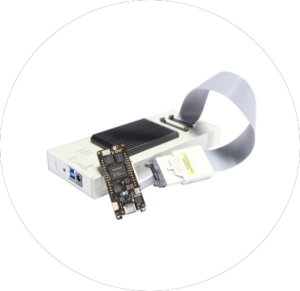
Debugging Portenta H7 with TRACE32®
The Arduino Core software for this board has been enhanced with Arm‘s Mbed OS and MRI (Monitor for Remote Inspection), which is a serial monitor with a GDB compatible interface. The TRACE32 front-end de bugger is used to connect to this monitor running on the target. Debugging in this way removes the need for a dedicated JTAG interface but requires that the under- lying Operating System and Serial interface are functioning correctly on the target. This is known as ‘run mode debugging’ and allows TRACE32 to view and control any process or thread running as part of the target ap- plication, as well as provide access to the shared memory region of the Cortex-M4. A typical example of this system is gdbserver for Linux systems.
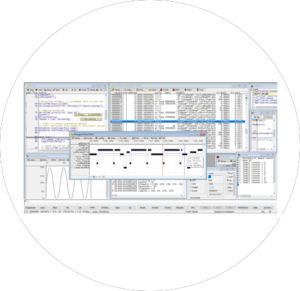
The Portenta H7 board connects to the computer via a USB-C port that emulates one or more serial ports which can be used for flash programming, print and de- bug via TRACE32. Thanks to the partnership with Arduino, the use of this „run-mode“ debugger is granted free to users of the Portenta H7. Users will be able to register on the Lauterbach site, enter the unique serial number of their Portenta H7, download software and license-keys and in a few minutes have their first experience with a powerful professional debugger.
Users who require more advanced debugging and trace features can purchase an Arduino carrier board, such as the Portenta Vision Shield, which houses the connector (MIPI-20 or MIPI-20T) to attach a hardware debugger, such as the well-known μTrace from Lauterbach, with JTAG/SWD or JTAG/SWD + TRACE interfaces. The same type of connector can also be provided on any boards created based on the Portenta H7 design, thus exploiting TRACE32 for their hardware projects.
This low-level hardware connection to the Portenta device allows for much deeper debugging. The MRI based debugger can only access code executing on the Cortex-M7 core but the hardware-based debugger can access both cores, as well as providing non-intrusive access to memory during runtime. When TRACE32 is- sues a break command, the entire target halts, not just a single process or thread. This is known as „stop mode debugging”. Once the target has halted, the debugger has full view of all target resources: registers, memory, peripheral devices, and code running on both or either core(s). In a multi-core configuration, it is possible to synchronise the Start, Stop and Step events so that both cores start, stop and step in parallel at the same time.
Stop-mode debugging is a very powerful tool but does have a disadvantage: when the target stops, all communications with outside world stop. Software that is running protocol stacks such as Wifi, Bluetooth or USB has also halted and this can cause a disconnect. Often, a mix of run-mode and stop-mode debugging can be used to work around this but the Portenta H7 has an even more powerful trick up its sleeve: trace-based de- bugging. In this mode, both cores provide information about the code that is being executed as it happens and the TRACE32 trace tools (μTrace or CombiProbe) sample this to provide a complete record of everything that each core has done during the sample period. This information is also time-stamped so developers can tell how long something took to execute or how frequently something happened. All of this happens non-intrusive- ly and without affecting the real-time performance of the application and any protocol stacks it may be running.
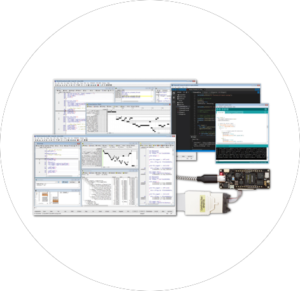
Trace based debugging is a very powerful addition to any embedded developer’s toolbox and the Cortex-M cores provide both on-chip (also known as Embedded Trace Buffer or ETB) and off-chip (also known as Em- bedded Trace Macrocell or ETM) trace, as well as the Instrumentation Trace Macrocell (ITM) and Data Watch- point and Trace unit (DWT) familiar to many Cortex-M developers. These powerful features are built-in to the Cortex-M and allow developers to trace code, without intrusion, and to generate user defined software trace to track important events. Stopping at a breakpoint or exception, a complete path of how both cores arrived at this point is immediately available, allowing even very complex bugs to be tracked down efficiently.
Switching from monitor based debugging to JTAG based debugging and, then, to trace based debugging is transparent to the developer. The same TRACE32 interface is used in all cases and just some new menu options appear as extra features become available. This provides a smooth transition from the free tools to TRACE32 hardware-based tools without the need to learn a new debug interface. The knowledge gained and any configuration/automation scripts created using the free tools immediately transfer to the more sophisticated tools.
Lauterbach takes the trace very seriously, as it is a particularly useful tool for all stages of development. μTrace and CombiProbe systems are equipped with 256 Mbyte or 512 Mbyte trace storage, respectively, and can be extended indefinitely with the trace-streaming technique for long-lasting recordings. In addition, TRACE32 implements countless features for trace analysis and display which are much appreciated by users. The trace is used to speed up debugging, to make timing measurements and program profiling, to discover and resolve bugs that only occur at run-time, to debug „backwards“ in time with CTS (Context-Tracking-System), for statistical analysis and, finally, for code coverage measurements. All in a simple and non-intrusive way.
Lauterbach TRACE32® Systems
Lauterbach provides modular debug systems which are highly configurable and support debug and trace options on a wide range of target processors. They also provide a low-cost dedicated Cortex-M debug and trace unit called the μTrace. This device supports all Cortex-M based processors, including the Portenta H7.
The modular JTAG or CombiProbe based debug systems can be expanded to add support for ARMv7 and ARMv8 devices, as well as other non-ARM cores, and help future-proof your investment.
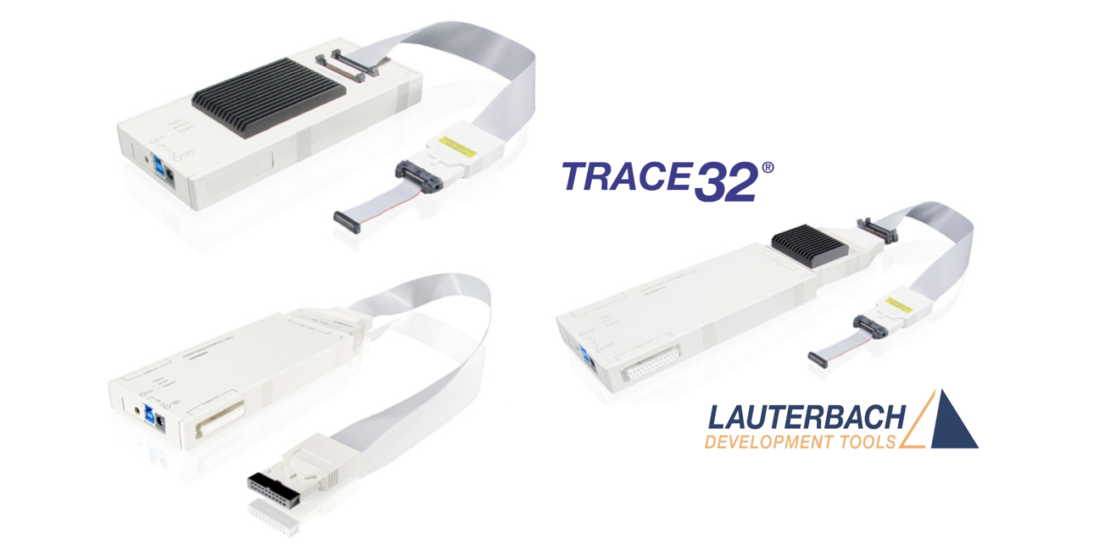
TRACE32® debug features for Cortex-M:
- Support for JTAG, Serial Wire Debug (SWD), and cJTAG (IEEE 1149.7) standards.
- 256Mbyte trace storage for μTrace and 512Mbyte for CombiProbe, almost infinitely expandable with trace streaming
- Reduced pitch MIPI 19/20/34 pin and JTAG ARM 20pin connectors
- Voltage range 0.3V to 3.3V (5V tolerant), or 0.3V to 5.25V for JTAG only
- Expandable digital and analogue probes to sample signals and act as a protocol analyzer
- Advanced low-power and sleep modes supported
- Optional multi-core support
- On-chip trace support
- Hardware resource dependent off-chip trace support
